Language: R
Dataset: abalones.csv
This project is all about creating policy for Abalone harvesting based on observed Abalone shell data. Below is a brief explanation of background, followed by my final results, and then more detail below that for anyone who wishes to dig deeper.
Background
The accidental harvesting of infant Abalones can cause major problems for the sustainability of Abalone populations. However, determining which shells belong to adult Abalones and which belong to infant Abalones based on shell size and other markings is not a simple task for the layperson. By extracting the insights available from our current dataset of 1,036 harvested Abalone shells, we can put forward several possible policy recommendations as to which shells harvesters can keep, and which need to be thrown back.
Results
After conducting exploratory data analysis, we have identified shell volume as a particularly useful metric in determining whether to harvest abalones or throw them back. The figure below helps illustrate how this works.
If you familiar with ROC curves, please proceed to the next paragraph for further review of results. If you are unfamiliar with ROC curves, think of the image below as depicting a decision boundary. The upper right hand corner represents maximum shell volume and the lower right represents minimum shell volume. The Y axis shows us the adult abalone population, and the X axis shows us the infant abalone population. The blue line going across illustrates the impact of our decisions on harvesting or releasing abalones based on shell volume. By tracing points along that blue line back to the Y and X axes, we can see the proportion of adult and infant abalones whose shell volumes are at or above a certain measure. Our policy objective here is to select a point along that boundary which represents the harvesting cutoff. Only shells with a volume as large or larger than the selected cutoff can be harvested.

I’ve highlighted three possible recommendations along this decision boundary in the image above. The most conservative of these (farthest to the left) is labeled “max. difference” and it represents the shell volume cutoff point at which we maximize the difference between the proportion of adult Abalones harvested and the proportion of infant Abalones harvested. In other words, the point at which we maximize the tradeoff between protecting the infant population while still harvesting the greatest number of adult Abalones. The least conservative point (farthest right) is labeled “zero A1 infants,” and is simply the point along this decision boundary in which all infants belonging to the smallest/youngest class can be protected. Between these two points is a benchmarker labeled “equal harvest,” which marks the point along our decision boundary in which the proportion of infants wrongfully harvested is equivalent to the proportion of adults going unharvested. This is a useful benchmarker for our purposes simply because our objective is to balance the needs of harvesters with our conservation objectives and this point marks the midway between each of these competing goals.
Policy Discussion
Each of the three cutoffs has its own logic and would represent a reasonable solution given a certain circumstance. The maximum difference cutoff capitalizes on the point at which the total value involved in the tradeoff between protecting infants and harvesting adults is maximized. It also happens to be the most conservative, however, with a true positive rate of just 0.74 and a false positive rate of roughly 0.18. If profitable yields cannot be reached using this cutoff, and if we estimate that the current population is capable of withstanding more infant harvesting than this, then increasing our cutoff will make more sense.
The logic behind the equal error method would simply be that of splitting the difference on error. This approach represents a tradeoff between conservation and commerce, with a false positive rate of roughly 0.22 (the proportion of the infant population harvested) and a true positive of 0.78 (proportion of adult population harvested).
The least conservative of these proposed cutoffs sees a steep jump up in false positive rate at 0.29, but only a slight increase in true positive rate (0.83). This option is viable only if the current population is strong and the needs for harvesting efficiency are high.
Recommendation
In this hypothetical example, we do not have statistics to measure total population health. We also do not understand the needs of amateur and commercial harvesters. However, both these factors are vital in using the information above to make a policy recommendation. Assuming we did know these two crucial pieces of information however, we could reach a conclusion using goal programming. Here our primary objective would be the conservation of a certain proportion of the infant population and our secondary objective would be maintaining a certain level of harvesting efficiency based on our understanding of commercial and amateur harvesting needs. Sensitivity analysis, which explores the impact of incorrect assumptions or invalid data on observed outcomes, would be an important component of such an analysis
EDA and Further Details
This section contains code and depicts the full data analysis project as I conducted it. In time, I will extrapolate on the thinking/motivation behind all of this. For now, it is primarily just code and data visualizations.


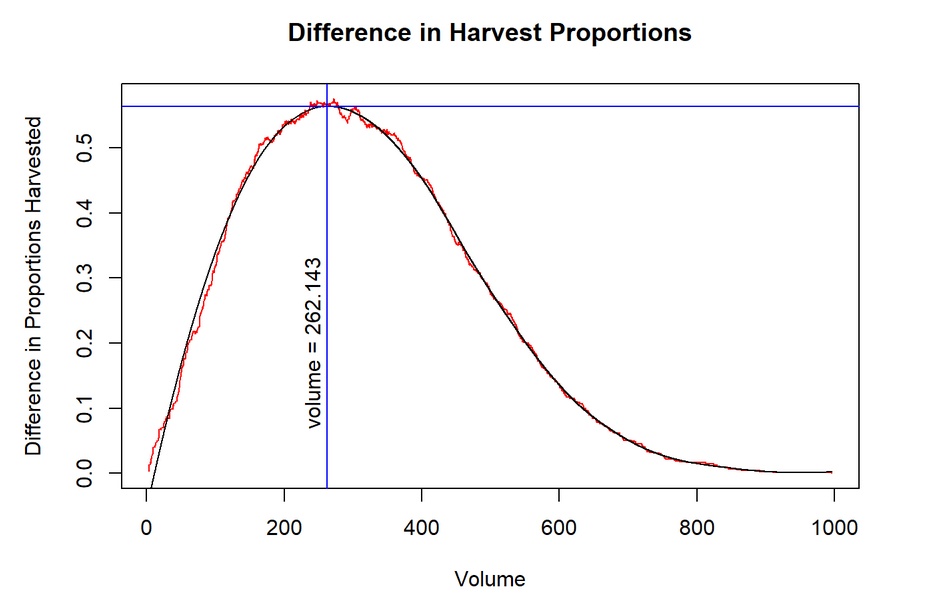
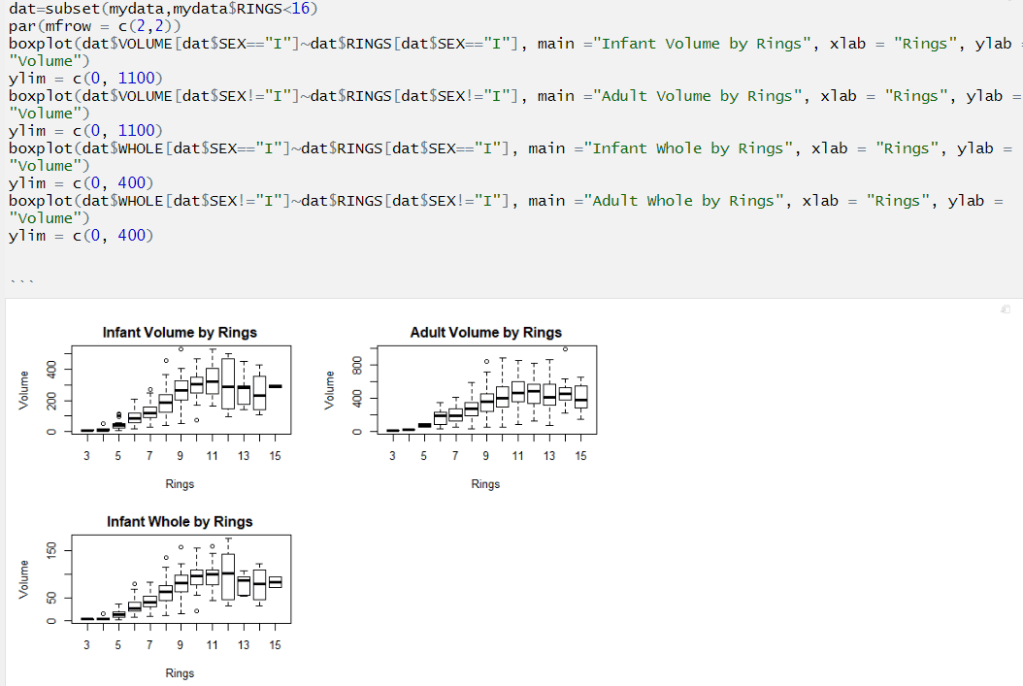
Note that infant abalones of the later classes see volume flatten out. This suggests that volume is an excellent predictor even for infant abalones in the latter classes.
Data Transformation
Here we look at a log10 transformation of the RATIO variable.
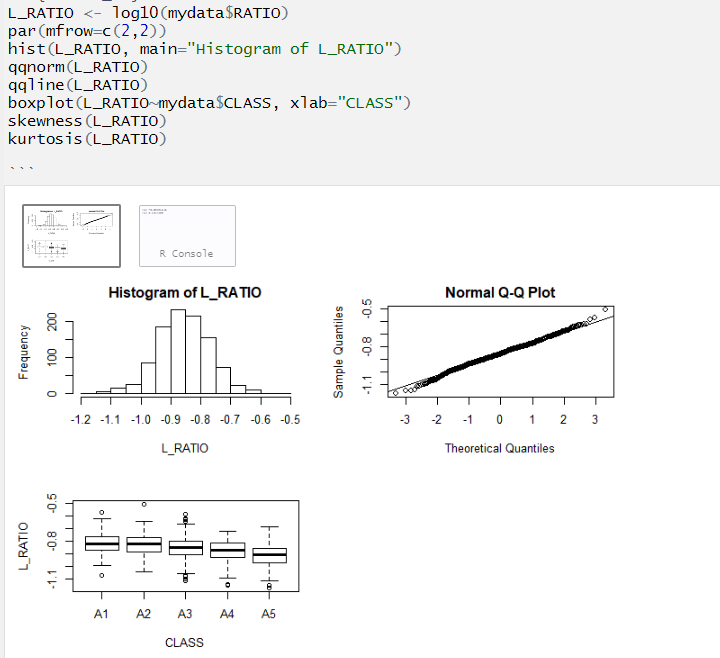

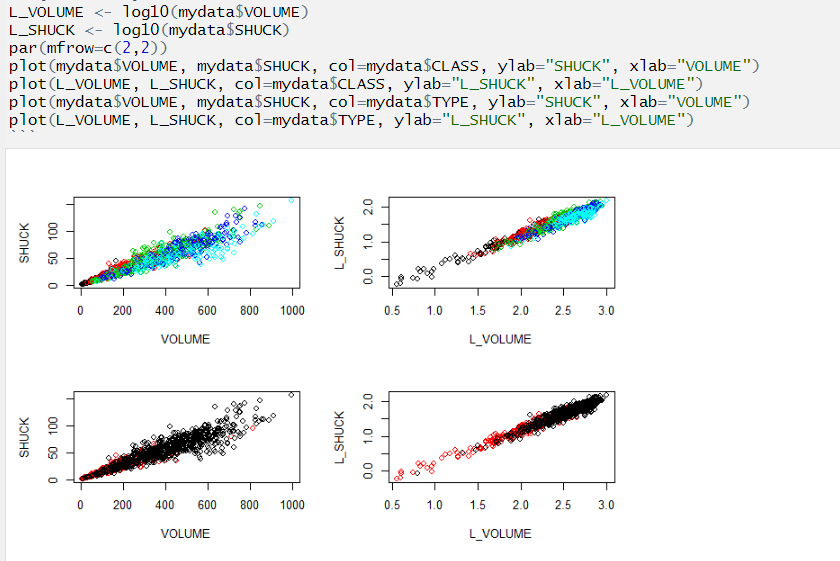
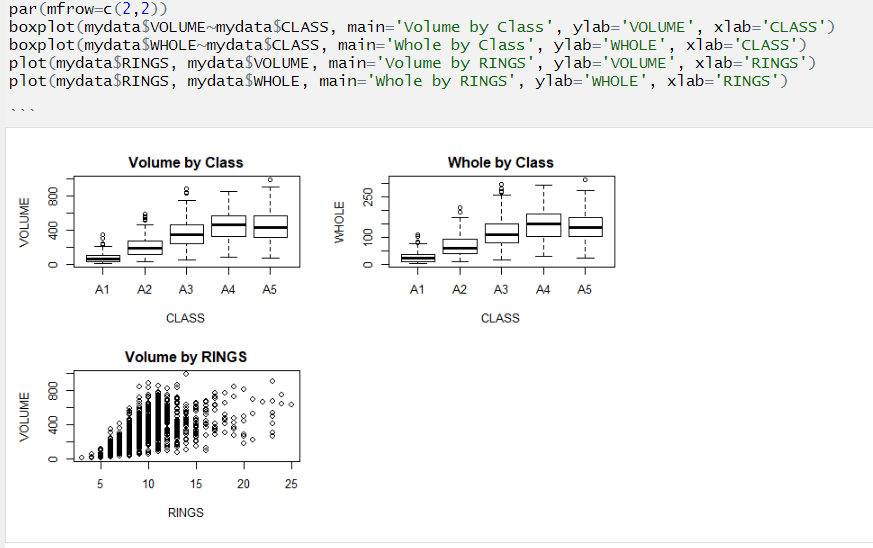
The plots above show that variability is reduced in the log transformed data. This is a good thing for our prospects of using linear regression analysis. The relationship between L_VOLUME and L_SHUCK is more strictly linear than it was prior to transformation. Generally speaking, the lower the class, the lower the volume. Additionally, infant abalones appear to have lower volume than adults.
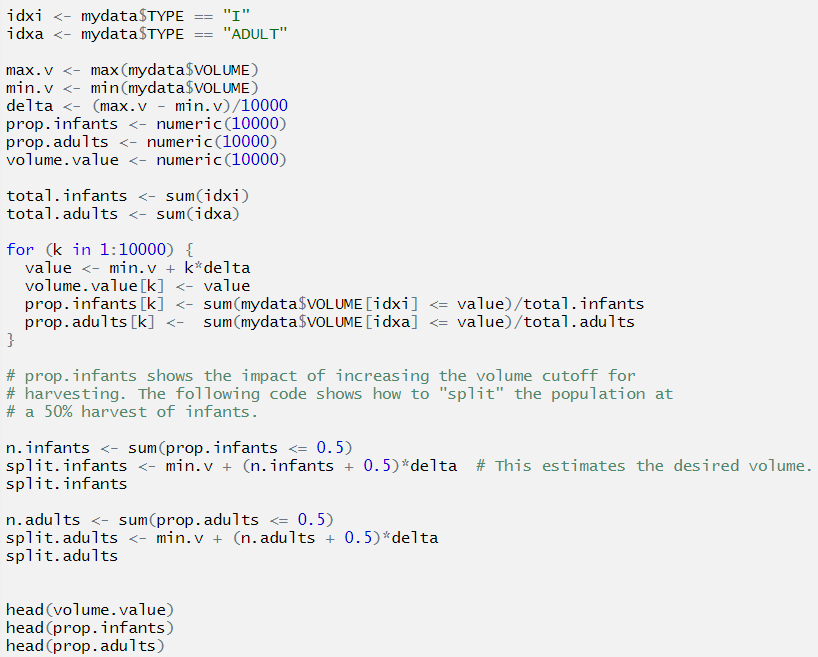

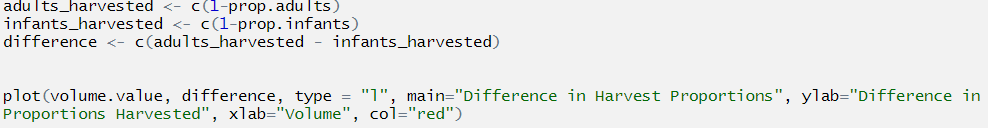
Determining where we can maximize the difference between false positive and true positive rates is one possible idea for making good policy. Let’s discover where that lies.